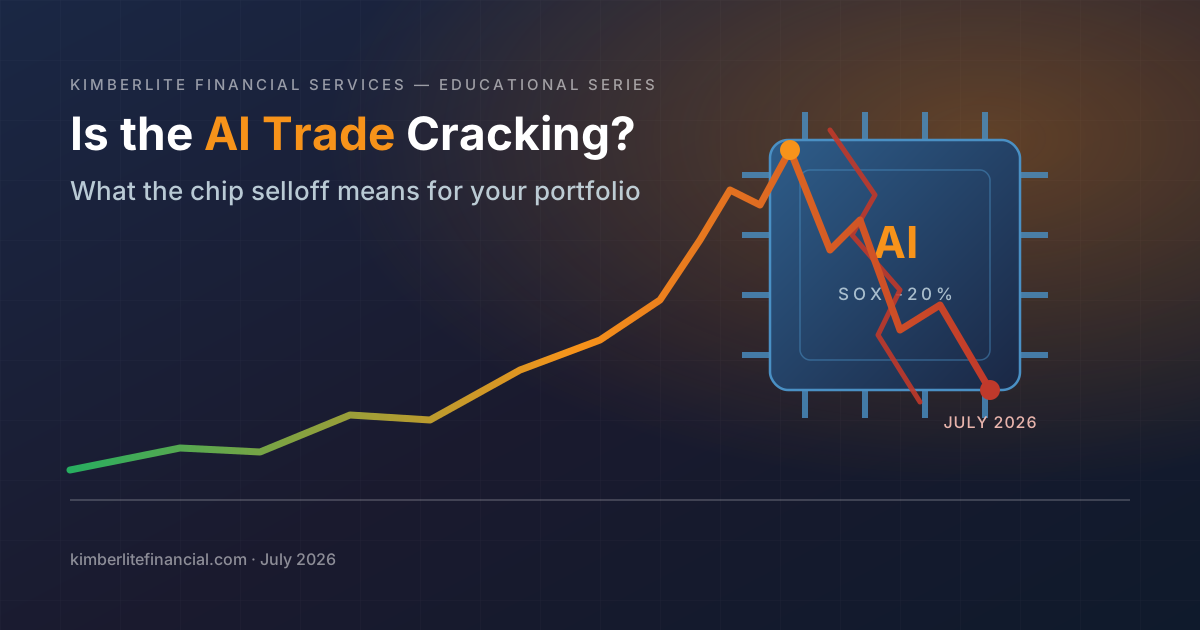
Semiconductor stocks just fell roughly 20% from their highs, "AI bubble" became one of the most-searched financial phrases in America — and most people asking the question own more AI exposure than they realize.
Over the first two weeks of July, searches for "AI bubble," "chip stocks," and "semiconductor selloff" surged as the market's hottest trade hit its roughest stretch in years. Here's what actually happened, what the 2000 comparison gets right and wrong, and why this matters even if you've never bought a chip stock in your life.
For more than two years, artificial intelligence has been the engine of the U.S. stock market. Chipmakers, cloud providers, and the companies building AI data centers powered most of the market's gains — and grew into a historically large share of it. In early July, that trade stumbled hard, and financial search engines lit up with one word: bubble.
This post is an educational walk-through of what happened, why it rattled investors, and what it means for regular households — most of whom own far more AI exposure through ordinary index funds than they realize. Not advice. Not a prediction. Just a map.
A few catalysts converged. On July 1, reports emerged that Meta plans to launch a cloud unit selling its surplus AI computing capacity to other companies — a move investors read as a sign that the frantic race to buy chips may have produced more capacity than near-term demand requires. Days later, headlines about rapid progress from Chinese AI models added a second scare. Chip stocks that had roughly doubled over the prior year fell hard and fast: double-digit single-day drops for some names, and a roughly 20% peak-to-trough slide for the semiconductor index as a whole.
The strangest part: fundamentals largely stayed strong. Samsung reportedly posted one of the largest year-over-year profit jumps in its history during the same stretch its stock was falling. When great earnings meet falling prices, the market is repricing expectations, not results — and that's precisely the dynamic that gets people typing "bubble" into a search bar.
Comparisons to the dot-com era are everywhere right now — one widely cited Wall Street "bubble risk" gauge recently approached levels last seen in mid-2000, and more than one strategist has drawn the parallel explicitly. It's worth being honest about both halves of that comparison.
Here's the uncomfortable truth the search results won't give you: nobody knows which half wins. The internet was both a bubble in 1999 and the defining technology of the next 25 years. Both things were true. Anyone claiming certainty about where AI stocks go next — in either direction — is selling confidence, not analysis.
The reason this story matters for ordinary households isn't the drama in chip stocks. It's concentration. The 10 largest companies in the S&P 500 — most of them tied to the AI theme — now make up roughly 40% of the entire index, near the highest level ever recorded.
If you own an S&P 500 index fund in your 401(k) or IRA — as tens of millions of Americans do — roughly four dollars of every ten are invested in about ten companies whose fortunes rise and fall together with the AI story. That's not a flaw in index investing, which remains a remarkably effective, low-cost way to own the market. But it does mean "I just own an index fund" and "I'm broadly diversified" are less synonymous than they were a decade ago.
Many investors hold an S&P 500 fund, a growth fund, a tech fund, and a target-date fund — and effectively own the same ten stocks four times. Reviewing what's inside each holding is step one, and it's the step most people skip.
International stocks, small and mid-caps, value-oriented funds, bonds, and real assets each respond to different forces. Diversification means owning things that don't all need the same story to succeed.
A rebalancing schedule systematically trims what has grown large and adds to what has lagged — quietly reducing concentration after big run-ups without requiring a market prediction.
Volatility in growth stocks is a problem for money you need in three years, and mostly noise for money you won't touch for twenty. The right response to a selloff depends less on the market and more on when you need the dollars.
Kimberlite Financial Services offers educational portfolio reviews that map your true concentration across funds and accounts — index funds, retirement plans, and individual holdings — in the context of a complete financial plan.
Educational Content Only. This content is provided by Kimberlite Financial Services for educational and informational purposes only. It is not personalized investment, tax, legal, or insurance advice and should not be relied upon as such. Nothing in this post is a recommendation to buy, sell, or hold any security, sector, or fund. The information presented reflects publicly available reporting and market data as of the date of publication and may become outdated. Market statistics are approximate, drawn from third-party sources believed reliable but not guaranteed.
Investing involves risk, including the potential loss of principal. Past performance — of markets, sectors, indexes, or any strategy, including diversification and rebalancing — does not guarantee future results. Diversification does not ensure a profit or protect against loss in a declining market. Index performance references are for illustration; you cannot invest directly in an index. References to specific companies are illustrative of market events and are not endorsements or recommendations.
Before making any financial or investment decision, consult with a qualified professional who can evaluate your specific situation. Kimberlite Financial Services makes no representations or warranties regarding the completeness or accuracy of the information presented.