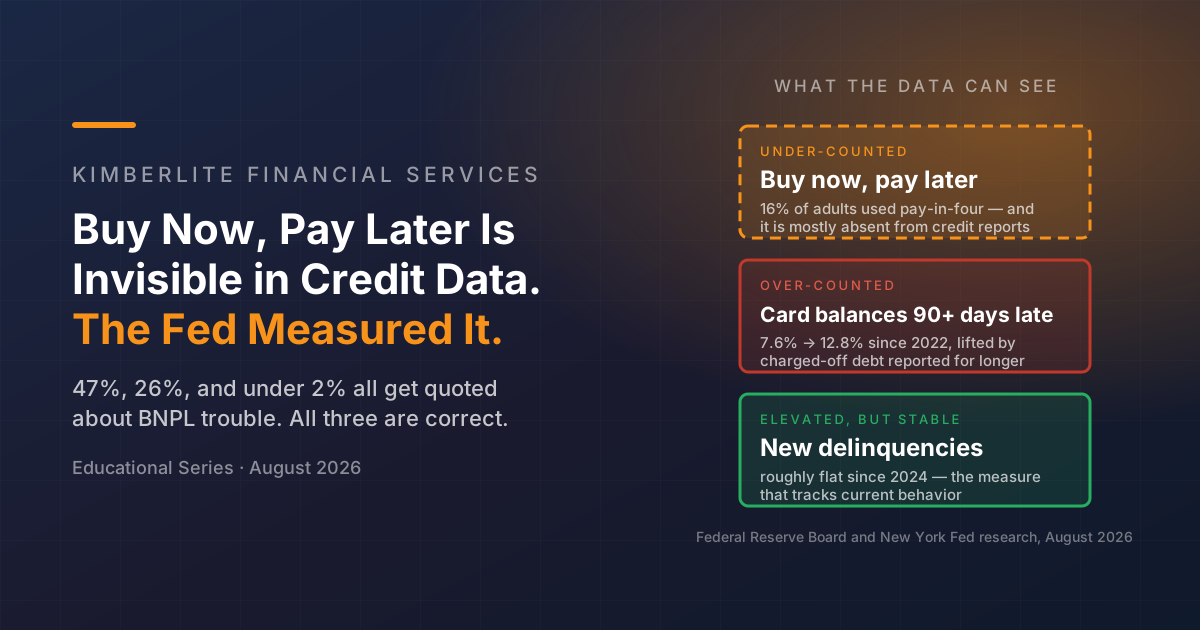
One of the more useful habits in personal finance is asking what a number actually counts before reacting to it. This post walks through two live examples, both published in the last two weeks, both about household debt, and both pointing in opposite directions.
On August 19, the Federal Reserve Board devoted an entire issue of its Consumer & Community Context publication to a single question: what do we actually know about buy now, pay later?
That the Board is answering it with survey data rather than credit data is the story. The New York Fed publishes quarterly credit card, mortgage, auto, and student loan balances drawn from its Consumer Credit Panel, an anonymized sample of credit records. But pay-in-four loans mostly do not appear in credit reporting at all, so what the Board can say about them comes instead from questions added in 2021 to its annual Survey of Household Economics and Decisionmaking, fielded among nearly 13,000 respondents.
Search behavior suggests a lot of people want that answer too. A Semrush-owned trend tracker, in data last updated August 18, 2026, lists buy now, pay later at roughly 110,000 U.S. searches a month and up about 109% over two years. The same list is dense with terms from the same neighborhood: home equity loan, high-yield savings account, autopay, and a nonprofit that helps people file Chapter 7 bankruptcy without a lawyer. Those are proprietary estimates from one vendor rather than an official statistic. They are the reason this topic was chosen; they are not evidence of anything else in this post.
Three Numbers, One Question
47%
2026. Share of BNPL users who told LendingTree's survey they had paid late on a BNPL loan at some point in the previous year — up from 41% in 2025 and 34% in 2024
26%
2025. Share who said much the same thing in the Federal Reserve's Survey of Household Economics and Decisionmaking, published in the Board's August 2026 BNPL issue
1.83%
2023. Share of BNPL loans charged off, from CFPB supervisory data covering six of the largest providers. This counts losses, not late payments. Dollar-weighted it is 0.92% — and see the caution below about comparing it with credit cards
11%
2025. Share of BNPL users whose BNPL payment triggered an overdraft or non-sufficient-funds fee at their bank in the prior year, per the Fed's August 2026 issue
The first three look like a contradiction and are not one — they count different things, over different years. The fourth gets less attention than the others and is where a good deal of the actual cost sits.
What the Product Actually Is — and the Definition Trap
Almost every argument about buy now, pay later goes wrong in the first sentence, because two very different products share the name.
Pay-in-Four
The original product, and the one all the research above measures. The purchase is split into four equal payments over six weeks: 25% at checkout, then three payments two weeks apart. These are commonly advertised as carrying no interest when paid on schedule. Underwriting is described as light — typically a soft credit check rather than a hard inquiry on a first loan, then the provider's own repayment history. Generally not furnished to the credit bureaus.
Longer Installment Loans
Also offered by BNPL companies, also marketed as BNPL, and a different animal. These are for larger purchases, repaid over months or years. According to the Richmond Fed brief cited throughout this post, they usually involve a hard credit check, carry interest or finance charges, and are reported to credit bureaus. The brief excludes them from its BNPL analysis for that reason — they are already captured in normal credit statistics.
Why It Matters to You
"BNPL is interest-free," as commonly advertised, describes the first column, not the second. "BNPL doesn't affect your credit" is largely but not entirely true of the first column, and not true of the second. A checkout screen may offer either. Terms vary by provider and by transaction and are set out in the provider's own disclosures, so reading which product is in front of you changes the answer to every other question here.
The scale, so nothing here gets overstated: a Richmond Fed Economic Brief by Zhu Wang estimates total pay-in-four transaction volume at roughly $70 billion in 2025 — about 1.1% of U.S. credit card purchase volume — and, using its own stated assumptions, puts the average amount outstanding at any moment near $3 billion, against roughly $1.23 trillion in credit card debt at the time of that analysis. The brief describes that as about 400 times larger. On the financial-stability question its conclusion is that, at current scale, the impact "appears limited." Views in that brief are the author's own, not necessarily those of the Bank or the Federal Reserve System, and this post takes no position of its own on the question.
Who Uses It, and Why — Including the Part That Cuts the Other Way
The Fed's August issue found that 16% of all U.S. adults used pay-in-four BNPL in 2025, a share the Fed reports as having increased each year since it began asking in 2021. Nearly one in five women used it — a gap over men that persists after accounting for income, education, and age. Use runs higher among younger adults, adults without a bachelor's degree, and Black and Hispanic adults.
Use also varies sharply with liquidity. Among adults who said the largest emergency expense they could cover from savings was under $100, 31% used BNPL. Among those who could cover $2,000 or more, it was 8%.
That looks like a story about desperation. The Fed also asked users why they used it, and the answers complicate that reading.
Why people say they use it. The top two reasons given in 2025 were wanting to spread out payments (87%) and convenience (82%). "Only accepted payment method I had" was the least common reason offered — dead last. That ranking has been stable every year the survey has asked. Separately, the CFPB's consumer-level study found that most BNPL users retain access to traditional credit; they are not cut off from cards and choosing this instead. And even borrowers with no FICO score or deep-subprime scores repaid their BNPL loans about 96% of the time. Those figures describe reported usage and repayment; they are not an assessment of the product, and they sit alongside the risks described below rather than cancelling them.
The Richmond Fed brief also sets out the economic case on both sides. A pay-in-four loan repaid on schedule carries no interest charge, so for someone who would otherwise revolve a card balance at rates the brief describes as commonly running 18% to 30%, it can cost less — though whether it actually does depends on that person's account terms, repayment behavior, and exposure to the bank fees described in the next section. On the other side, the brief notes that for consumers with thin liquidity or limited cash-flow planning, the same product can pull spending forward, thin the buffer further, and raise vulnerability to the next shock. Its conclusion is that the welfare effects are "mixed," with no clear evidence that BNPL causes higher overall indebtedness — users carry more unsecured debt than non-users, but the brief states plainly that causation could run either direction.
So Why Do the Late-Payment Numbers Disagree?
Because they are answering three different questions. Here is what each one actually asks.
47% — "Have you ever been late in the past year?" This is LendingTree's April 2026 consumer survey, and the wording matters enormously. One late payment on one loan, once, twelve months ago, counts. A person with four BNPL loans has four chances to trip. The measure has risen consistently — 34%, then 41%, then 47% — which is a real and worth-noting trend. But it is a survey of self-reported incidence, not a delinquency rate, and LendingTree itself notes it is not comparable to CFPB or industry delinquency measures. It is also a nonprobability online panel.
26% — the same question, asked by a different survey. This is the Fed's SHED, a nationally representative survey of nearly 13,000 respondents — of whom roughly one in six reported using BNPL, so this figure rests on a base near 2,000 users. Twenty-one points below the LendingTree number — though part of that is timing, not method: against LendingTree's own 2025 wave, which read 41%, the gap is closer to fifteen points. What remains is still a wide spread between two carefully run surveys asking nearly the same question, and that spread is itself a finding. Sample design and question wording move results on this behavior more than most people assume, and neither survey is the “real” one. The Fed's companion number is that 17% were actually charged extra for paying late — so a meaningful share of late payments carried no fee.
1.83% — "What share of loans were charged off?" This one is not a survey at all. It is a charge-off rate from CFPB supervisory data covering actual loan-level performance at six of the largest providers. It fell from 2.63% in 2022 to 1.83% in 2023, and on a dollar-weighted basis from 1.71% to 0.92%. A loan can be paid late and still be repaid in full, which is exactly why "47% were late" and "under 2% were charged off" can both be accurate.
And a comparison this post is not going to make cleanly. You will often see the BNPL charge-off rate set against the credit card charge-off rate at U.S. commercial banks, which was 4.19% in the fourth quarter of 2023. Both figures are real, and they are not like-for-like in at least three ways: the BNPL figure counts loans while the bank series is dollar-weighted; the BNPL figure is a per-loan loss rate on a six-week obligation while the bank figure is an annualized rate on revolving balances; and the two are produced by different collection processes. They are reported here as each source reports them. Treat "BNPL losses have run below card losses" as a directional observation that the published figures point toward, not as a measured result.
One more difference is easy to miss and matters as much as the definitions: these numbers cover different years. The charge-off figure is from 2023, the Fed's survey from 2025, LendingTree's from 2026. So the synthesis has to be stated carefully: self-reported late payments are common and rose across consecutive survey waves through 2026, while the most recent published loss data runs only through 2023 and showed losses falling. Those two facts do not conflict, and neither one updates the other.
The Cost That Isn't Interest
Here is the mechanism that gets the least coverage and does the most damage.
Pay-in-four providers commonly require a debit or credit card to be attached at checkout with automatic payments enabled. The Fed's August issue describes this, along with the down payment and a check that funds are available at the time of purchase, as part of why repayment rates run as high as they do. It also means three scheduled debits land on dates set by the purchase rather than by the borrower's pay cycle, against whatever instrument was attached at checkout, whether or not the balance is there that morning.
The Fed found that 11% of BNPL users had a BNPL payment trigger an overdraft or NSF fee in the prior year. And it lands where you would expect: 18% among users who could not cover a $100 emergency from savings, versus 4% among those who could cover $2,000 or more.
The broader comparison is starker. Among bank account holders, 30% of BNPL users incurred an overdraft fee on some transaction in 2025, against 8% of non-users. Overall, 12% of adults with a bank account paid one.
A number this post is deliberately not going to publish. It is tempting to take that 20% and annualize it into a three-digit percentage, and you will see people do it. We are not going to, for two reasons. An overdraft fee is a one-time flat charge triggered by a specific event, not a rate that accrues and compounds, so annualizing it produces a figure that looks like an interest rate and is not one. And the choice of denominator changes the answer substantially — 25% of the purchase was paid at checkout and never financed at all. The honest version needs no annualizing and is bad enough: a single bank fee can cost more than four-fifths of the payment that caused it, and it is charged by the bank, not the BNPL provider — which is why it does not appear in the provider's own fee schedule.
The Fed also found repayment trouble concentrates by what was purchased. Among users who bought groceries or food delivery with BNPL, and among the 8% who financed medical or veterinary procedures — where 34% were charged late or hit an overdraft — problems were meaningfully more common, even comparing people at similar incomes.
The Reporting Gap: Invisible Now, Changing Unevenly
This is where consumer coverage gets it wrong in both directions, so it is worth stating carefully.
As of the Fed's August 2026 issue, most BNPL lenders still do not furnish pay-in-four loans to the credit reporting agencies. The Fed's explanation is that the products do not fit the existing reporting infrastructure. The practical consequences run three ways: on-time payments generally earn no credit, late payments generally go unrecorded, and these balances generally do not appear in the credit report a lender pulls. The Fed notes one exception: a BNPL debt sent to collections is visible in credit reporting data like other third-party collections.
Several things are changing that, at different speeds:
- FICO built the models. In June 2025 FICO announced FICO Score 10 BNPL and FICO Score 10 T BNPL, which FICO describes as the first credit scores from a leading scoring provider to incorporate BNPL data, offered alongside existing versions at no additional fee and available beginning in the fall of 2025. FICO states that its approach aggregates separate BNPL loans together when calculating certain variables, and that this was developed to address the pattern of several loans being opened in a short period.
- Provider positions differ. Per the Richmond Fed brief, Affirm began reporting loans to bureaus in 2025 and has stated the practice is intended to let responsible repayment be reflected in credit scores. Klarna and Afterpay have publicly cautioned against reporting, raising the concern that models built for revolving and long-term installment credit may misread frequent small short-term loans. Sezzle offers reporting as an option rather than a default.
- A model existing is not the same as lenders using it. FICO's own announcement says the BNPL scores are offered alongside existing versions so that lenders can evaluate them "while continuing to use FICO's industry-leading models they use today." FICO also states in that release that the FICO Score is used by 90% of top U.S. lenders. How quickly any new model is adopted is not something we can tell you, and we are not going to guess.
What this means practically, today: if a headline tells you BNPL "now affects your credit score," that overstates where things stand — the capability exists, furnishing is partial and voluntary, and model adoption is early. If a different headline tells you BNPL "doesn't affect your credit," that is also incomplete: at least one large provider now furnishes, another offers it as an option, and collection accounts have long been visible. Neither headline is a substitute for checking what your own provider does, which is set out in that provider's disclosures. Kimberlite expresses no view on whether these practices will broaden.
The Mirror Image: Your Credit Card Delinquency Number Is Being Misread
On August 11, the New York Fed published its Q2 2026 household debt report alongside a research post addressing a genuine puzzle: two respected measures of credit card delinquency have been telling opposite stories.
You have probably seen the alarming one. The share of credit card balances 90 or more days delinquent on credit reports rose from 7.6% in Q3 2022 to 12.8% by Q1 2026, widely reported as a fifteen-year high and as evidence that households are cracking. Meanwhile the New York Fed's flow measure, which counts balances newly entering serious delinquency each quarter, has been roughly flat for about two years, and the Federal Reserve Board's lender-reported series agrees with the flow measure.
The researchers reconciled them, and the explanation is entirely mechanical.
When a lender charges off a debt — which the authors describe as typically happening between 120 and 180 days past due — the balance comes off the lender's books entirely, exiting both the numerator and the denominator of lender-reported statistics. It registers once and is gone. But the borrower usually still owes it, and the lender may keep pursuing it and keep updating the credit bureaus, so it stays in the credit-report-based measure. And these debts are being reported for far longer than they used to be: between 2004 and 2012, about 40% of charged-off debts were still being reported a year later; by 2024, that figure had doubled to 80%. Strip severely derogatory balances out of both measures and the series converge closely. The authors' conclusion: the stock rate is rising "because of a pool of stale, charged-off debts that lenders have been reporting for longer durations, rather than a fundamental worsening in the incidence of delinquency." The pace of new credit card delinquency is elevated, but has been largely stable since 2024.
Two caveats belong with that, and the same researchers supply them. Elevated-but-stable is not good; the flow rate into serious delinquency for credit cards was 6.97% in Q2 2026, essentially unchanged from 6.93% a year earlier, and new auto and card delinquencies remain at elevated levels. And the stock measure is not wrong — it is the right measure for a different question, because more than 23 million Americans are still carrying charged-off credit card balances on their reports, and those debts are real obligations even after the lender has written them off.
Set the two halves of this post side by side and the shape is clear. BNPL is under-measured because it is largely absent from credit files. Credit card delinquency looks worse than the underlying behavior because charged-off debt lingers in credit files longer than it used to. Same data infrastructure, opposite distortions, and in both cases the number in the headline is not measuring what the headline says.
The Shift Toward Essentials
One trend in the Fed's data deserves separate attention because it is where the product changes character.
Clothing and accessories remain the most common BNPL purchase at 49% of users, followed by electronics (32%) and furniture or appliances (26%). But one in five users financed groceries or food delivery — and that splits sharply by income: 29% of users earning under $50,000, 19% in the $50,000–$99,999 band, and 9% of those earning $100,000 or more. Travel runs the other way; the Fed found the highest earners more likely than those under $50,000 to use BNPL for it.
Separately, CNBC reported in July 2026 that BNPL-style financing has extended to recurring household bills — rent, utilities, broadband, phone service — through specialized apps, with fee structures that differ from the no-interest-if-paid-on-schedule pay-in-four model, and in some cases carrying interest. Those products are outside the scope of the Fed and Richmond Fed research above, and their terms vary; we have not independently verified any specific provider's fees and are not describing them here.
The distinction that matters: financing a durable good spreads the cost of something you will still own in six weeks. Financing a recurring monthly bill does not — the next one arrives on schedule, on top of the installments for the last one. The Fed's finding that grocery-financing users were more likely to be charged late fees or hit an overdraft, even compared with people at the same income, is consistent with that arithmetic. This is a structural observation about repeating versus one-time expenses, not a judgment about anyone's circumstances or a claim about any specific provider's terms.
The Utah Number
Unpaid consumer debt can end up in court, and Utah's filing volume is measurable.
A Pew Charitable Trusts analysis published July 16, 2026, using court data compiled by January Advisors, found that debt collectors filed roughly 76,000 consumer debt collection cases against Utah defendants in 2025 — up 23% from 2019, with filings reported as approaching levels last seen after the 2007–09 recession. Against Utah's estimated 2025 population of about 3.54 million, of whom roughly 26% are under 18, that works out to roughly one filing for every 34 adults in the state.
Two things to hold onto before that number does any work on you. It counts filings, not distinct people — one person can be named in more than one case — and the per-adult ratio is our arithmetic on Pew's figures, not theirs. And the 23% increase is not adjusted for population: Utah has grown about 8% since the 2020 census alone, so on a per-resident basis the rise is closer to 14% than to 23%. A filing is also not a judgment; cases are dismissed, settled, and withdrawn.
Three details from that reporting are worth carrying around:
- 71% of Utah defendants in these cases do not appear in court, against 70% nationally. Pew reports that failure to appear commonly results in a default judgment, and that judgments can lead to collection actions including wage garnishment, liens, and seizure of personal assets.
- Only 4% of people sued retain a lawyer.
- Utah is not among the states Pew identifies as providing automatic post-judgment bank account protection. Pew's framing is about whether protection is automatic; Utah law does provide exemptions, which generally have to be claimed. Separately and regardless of state law, federal rules at 31 C.F.R. Part 212 require a bank served with a garnishment order to look back two months and protect directly deposited Social Security, SSI, VA, Railroad Retirement Board, and federal retirement benefits — up to the lesser of those deposits or the account balance, and not against garnishments by the United States or a state child-support enforcement agency.
None of that is about buy now, pay later. Pew's data does not identify how many, if any, of these filings originated in BNPL obligations, and the underlying debts are described as a mix of medical bills, credit cards, auto loans, consumer loans, and utility bills. Where any individual case originates is not something this data can tell us.
What Actually Deserves Your Attention
Knowable Today
- How many BNPL loans are currently open, and the exact dates the automatic debits hit. Neither is hard to establish and neither is typically tracked in one place. LendingTree's 2026 survey found 63% of users had held multiple loans at once and 25% had juggled three or more.
- Whether your provider furnishes to the credit bureaus. Practices differ by company and change over time, and the Richmond Fed brief records providers taking opposite positions on it. Confirm current practice with your own provider rather than assuming.
- Your bank's overdraft and NSF fee schedule, and whether the account offers a linked-savings transfer. Bankrate's 2025 study found 94% of surveyed accounts charge an overdraft fee and 61% charge NSF fees.
- Your credit report from each of the three nationwide bureaus at annualcreditreport.com — the site established under federal law for the free annual report, through which the bureaus have voluntarily offered free weekly access since 2020 and have said the weekly option is permanent. Utah Courts self-help and case-record information is published at utcourts.gov. Charged-off balances and collection accounts appear there.
- Whether a court filing has been made against you. Utah Courts publishes information about accessing case records, along with self-help resources for people without a lawyer, at utcourts.gov.
- What your emergency-expense capacity actually is. It produces a wide split in the Fed's tabulations — 18% versus 4% on the overdraft measure — and it is knowable in about five minutes.
Worth Knowing
- Pay-in-four is advertised as carrying no interest when paid on schedule. Longer installment loans marketed as BNPL usually do carry interest, and do involve hard credit checks and bureau reporting.
- Most pay-in-four loans are still absent from credit bureau data, so on-time payments generally earn no credit and the balances generally do not appear on a pulled credit report.
- FICO released BNPL-inclusive scores in 2025, offered alongside its existing models rather than replacing them.
- Reported late-payment figures range from under 2% to 47% depending on what is counted. Charge-offs measure losses; survey "ever late" figures measure incidence. They are not versions of the same number.
- Published BNPL charge-off figures have come in below published credit card charge-off figures, though the two are measured differently enough that the comparison is directional at best.
- The overdraft fee, not the BNPL fee, is often the largest single cost in a BNPL problem — and it appears on the bank statement, not the provider's.
- The 12.8% credit card delinquency figure is elevated in part by charged-off debts being reported longer, not solely by more people newly falling behind.
- Roughly 76,000 consumer debt collection cases were filed against Utah defendants in 2025, and 71% of those sued never appear in court.
What Not to Do
Common Mistakes Right Now
- Assuming the pay-in-four loan you used last time is the offer in front of you now. The same checkout button can present either product. The terms are disclosed; the two-minute read is the whole safeguard.
- Treating "no interest" as "no cost." The cost, when there is one, arrives as a late fee or an overdraft fee, and the overdraft fee is usually the bigger of the two.
- Losing track of the debit dates. Automatic payments on dates you did not choose are the entire mechanism behind that 11% overdraft figure. A calendar entry is free.
- Financing recurring bills the same way you'd finance a couch. The next bill arrives regardless. That is a different decision with different arithmetic.
- Assuming on-time BNPL payments are building credit. For most providers today they are not, while a debt placed with a collection agency may be furnished like any other collection account.
- Reading "credit card delinquency hits 15-year high" as a description of current household behavior. The New York Fed's own researchers have now explained why that reading does not follow.
- Leaving a court summons unanswered. Seventy-one percent of Utah defendants in these cases do not appear, and Pew reports that not appearing commonly means a default judgment. Utah Courts publishes self-help resources, and anyone served should talk to a lawyer.
- Concluding from any of this that BNPL is inherently bad. Sixteen percent of American adults used pay-in-four last year; charge-off rates on the loans have been low; the two most-cited reasons for using it were spreading payments and convenience, with “only accepted payment method I had” ranked last; and for someone who would otherwise revolve a card at the 18–30% range the Richmond Fed brief describes, it can cost less, depending on that person's terms and fee exposure.
The Bottom Line
The Federal Reserve is describing buy now, pay later through survey questions rather than credit data, because most of these loans are not in the credit system. In the same two weeks, New York Fed researchers explained that the scariest credit card statistic in circulation is elevated partly because charged-off debts are being reported for longer, not solely because more households are newly falling behind.
Both stories are about the same thing: a measurement system built for mortgages, cards, and auto loans, now being asked questions it was not designed to answer.
The general takeaways are small and durable. Which product is actually on offer at checkout is knowable and worth two minutes. Debit dates are knowable. What a single overdraft fee costs relative to the payment that triggered it is knowable. Whether on-time payments are being furnished anywhere is knowable, and for most providers today the answer is no. And when a number about household debt appears in a headline, asking what it counts before deciding how to feel about it is a reasonable habit — and on the two examples in this post, it changed the answer both times.
Want a clear picture of your own numbers instead of the national ones?
Kimberlite Financial Services offers educational planning reviews that connect cash flow, debt, taxes, insurance, and long-term goals into one picture — so decisions get made from your actual situation rather than from a statistic about the average household. Advisory services are provided for compensation; our services, fees, and conflicts of interest are described in Form ADV Part 2A and Form CRS, available on request and at adviserinfo.sec.gov.
kimberlitefinancial.com
Sources: Board of Governors of the Federal Reserve System, Consumer & Community Context, August 2026 issue, "What is Buy Now, Pay Later?" (staff contact Anna Tranfaglia), PDF dated August 19, 2026, page last updated August 21, 2026 — source of the 16% adult usage figure and the reported year-over-year increase in that share since 2021, the gender and demographic patterns, the 31%/8% emergency-expense split, the purchase-type table (clothing 49%, electronics 32%, furniture/appliances 26%, groceries/food delivery 20%, travel 19%, medical/veterinary 8%), the grocery-financing split by income (29%/19%/9%), the finding that the highest earners were more likely than those under $50,000 to use BNPL for travel, the reasons for use (spread out payments 87%, convenience 82%, "only accepted payment method" least common), the 26% paid-late and 17% charged-extra figures, the 11% overdraft/NSF figure and its 18%/4% split, the 34% figure for medical/veterinary purchasers, the 30%-vs-8% and 12% overdraft comparisons, the description of the down payment, linked automatic payments, and the funds-availability check at origination, and the statement that most BNPL lenders do not report to credit reporting agencies, with third-party collections the noted exception · Underlying survey: Federal Reserve Board, 2025 Survey of Household Economics and Decisionmaking (SHED), nationally representative, nearly 13,000 respondents · Federal Reserve Bank of Richmond, Zhu Wang, "Buy Now, Pay Later: Recent Developments and Implications," Economic Brief No. 26-05, February 11, 2026 — source of the ~$70 billion 2025 estimate, the 1.1%-of-credit-card-spending comparison, the ~$3.02 billion average outstanding and 400x credit card comparison, the 2.63%/1.83% loan charge-off rates, the corresponding dollar-weighted figures of 1.71% (2022) and 0.92% (2023), the 4.19% credit card charge-off comparison, the description of pay-in-four underwriting as relying on a soft credit pull for an initial loan and the provider's own repayment data thereafter, the 18–30% credit card revolving range, the 96% repayment figure for no-score and deep-subprime borrowers, the pay-in-four versus longer-installment definition, the Affirm/Klarna/Afterpay/Sezzle reporting positions, and the finding that welfare effects are mixed with no clear causal link between BNPL use and higher unsecured balances. Views in that brief are the author's, not necessarily those of the Richmond Fed or the Federal Reserve System · Consumer Financial Protection Bureau, "The Buy Now, Pay Later Market," December 2025, and "Consumer Use of Buy Now, Pay Later and Other Unsecured Debt" — source of the loan origination and average-loan-size series (19.8 million loans and $2.2 billion in 2019 rising to 335.8 million and $43.9 billion in 2023; average loan size $111 to $131), the charge-off data, and the consumer-level findings, all as reported in the Richmond Fed brief · Federal Reserve Bank of New York, "Household Debt Balances Decreased Slightly; Credit Card Delinquency Transition Rates Remained Steady," Quarterly Report on Household Debt and Credit, August 11, 2026 — source of all Q2 2026 balance and delinquency figures, including the $568 billion "other" category. The characterization of the 12.8% figure as a fifteen-year high is as reported in press coverage of the New York Fed data, including the Deseret News, July 19, 2026 · Donghoon Lee, Daniel Mangrum, Joelle W. Scally, Tejas Sinha, and Wilbert van der Klaauw, "How Distressed Are Consumers? Reconciling Diverging Credit Card Delinquency Measures," Liberty Street Economics, Federal Reserve Bank of New York, August 11, 2026 — source of the 7.6%-to-12.8% stock delinquency series, the charge-off accounting explanation, the 40%-to-80% change in reporting duration, the 23 million figure, the finding that the Federal Reserve Board's lender-reported series tracks the flow rather than the stock measure, and the conclusion that the pace of credit card delinquency is elevated but largely stable since 2024 · FICO, "FICO Unveils Groundbreaking Credit Scores That Incorporate Buy Now, Pay Later Data," June 23, 2025 — source for FICO Score 10 BNPL and 10 T BNPL, the aggregation approach, the side-by-side no-additional-fee offering, fall 2025 availability, and the statement that the FICO Score is used by 90% of top U.S. lenders · LendingTree BNPL Tracker / 2026 Buy Now, Pay Later Report, released April 13, 2026 (survey conducted by QuestionPro; late-payment questions fielded March 17–23, 2026 among 2,060 U.S. consumers ages 18–80) — source of the 47%/41%/34% self-reported late-payment series and the 63%/25% multiple-loan figures, as reported by Bloomberg Law on April 13, 2026 and Chain Store Age on July 17, 2026. LendingTree's "ever late in the past year" measure is not comparable to CFPB or industry delinquency rates · Bankrate, "Survey: ATM fees hit record high for third straight year while average overdraft fee dips," 2025 Checking Account and ATM Fee Study, published September 10, 2025, fielded June 2 – July 3, 2025 across 245 institutions in 25 markets — source of the $26.77 average overdraft fee, the $16.82 average NSF fee, and the 94%/61% incidence figures. This is the most recent edition; no 2026 study had been published as of this writing · CNBC, "Consumers turn to buy now, pay later for essential expenses — with growing risks," July 14, 2026 — cited for the extension of BNPL-style financing to rent, utilities, and other recurring bills · The Pew Charitable Trusts, "Debt Collection Lawsuits Continue to Flood State and Local Courts," July 16, 2026, using court data compiled by January Advisors, as reported by the Deseret News on July 19, 2026 — source of the ~76,000 Utah filings in 2025, the 23% increase since 2019, the 70% national and 71% Utah non-appearance rates, the 4% representation rate, the report that failure to appear commonly produces a default judgment which can lead to asset seizure, wage garnishment, and liens, the characterization of Utah filings as approaching levels last seen after the 2007–09 recession, and the absence of automatic post-judgment bank account protection in Utah · 31 C.F.R. Part 212, Garnishment of Accounts Containing Federal Benefit Payments — the interagency rule requiring financial institutions receiving a garnishment order to apply a two-month lookback and protect directly deposited Social Security, SSI, VA, Railroad Retirement Board, and federal retirement benefits, subject to the rule's stated limits and exceptions · Federal Trade Commission consumer alert, October 2023, and the nationwide credit reporting agencies' announcements, for free weekly credit reports at annualcreditreport.com · U.S. Census Bureau QuickFacts, Utah, vintage V2025 — population estimate 3,538,904 as of July 1, 2025, 26.1% of the population under 18, and 8.2% population growth since the April 1, 2020 estimates base · Search-interest figures are proprietary estimates published by Exploding Topics, a Semrush product, in its finance category, data last updated August 18, 2026; they are not an official statistic and are presented as one vendor's estimate. Third-party estimates, model outputs, and survey results are those organizations' figures, not Kimberlite Financial Services' forecasts.
Educational Content Only. This content is provided by Kimberlite Financial Services for educational and informational purposes only. It is not personalized investment, tax, legal, credit, lending, or debt advice, and should not be relied upon as such. Nothing in this post is a recommendation to buy, sell, or hold any security; to make or avoid any change to an investment portfolio; to open, close, or fund any account; or to use, avoid, or apply for any specific credit product, payment product, loan, financing arrangement, or provider. General statements about reading disclosures before agreeing to them, tracking payment dates, and responding to court papers are educational observations offered to a general audience; they are not tailored to any individual's circumstances and are not a recommendation regarding any specific legal proceeding. The information reflects publicly available research, agency publications, government data, and press reporting as of the date of publication and may become outdated.
What Kimberlite Financial Services is not. Kimberlite Financial Services is not a bank, credit union, broker-dealer, lender, payment provider, buy-now-pay-later provider, credit counseling agency, credit repair organization, debt settlement or debt relief company, collection agency, or law firm. It does not extend credit, repair or dispute credit reports, negotiate with creditors or collectors, settle debts, provide bankruptcy assistance, or practice law or provide legal representation. Descriptions of court procedures, judgments, garnishment, and state statutory protections are general summaries of publicly reported information, not legal advice and not legal conclusions about any individual's situation. Anyone who has been sued, served, or contacted by a collector should consult a qualified attorney; Utah Courts publishes self-help resources at utcourts.gov.
Third-party products and companies are described, not evaluated. References to specific companies — including Affirm, Afterpay, Klarna, Sezzle, FICO, LendingTree, and Bankrate — are factual descriptions drawn from the cited sources and from those companies' own public statements. They are not recommendations, endorsements, disparagements, ratings, or assessments of any company, product, or its terms, and no comparison among providers is intended or should be inferred. Product features, fees, interest charges, and credit reporting practices vary by provider, by product, and over time; they are set by those companies rather than by Kimberlite Financial Services, and should be confirmed directly with the provider. Kimberlite Financial Services receives no compensation from any company, research organization, or news source named in this post.
Illustrations are hypothetical; third-party figures are theirs. The installment arithmetic, the fee-to-installment and fee-to-purchase percentages, the Utah per-adult filing ratio, the population-adjusted filing increase, the approximate 2,000-respondent base implied by applying the reported 16% usage rate to the survey sample, and the observation that the gap between the 26% late-payment figure and the 17% charged-extra figure implies some late payments carried no fee, are all simple arithmetic performed by Kimberlite Financial Services on published third-party figures and stated assumptions. They combine an average loan size from 2023 data with an average fee from a 2025 study, are presented only to illustrate scale, and do not describe any actual loan, account, fee, transaction, or person. They are not quotes, offers, projections, annual percentage rates, disclosures under the Truth in Lending Act, or performance results. Individual results will differ. The estimate of average BNPL balances outstanding, and its comparison to credit card balances, are the Richmond Fed brief's figures computed on that author's stated assumptions, not ours. Survey figures cited here come from separate surveys with different methodologies, sample designs, question wordings, and field dates, and are not directly comparable to one another; neither are charge-off rates measured on different bases and over different loan terms. That non-comparability is itself a subject of this post.
No predictions. Kimberlite Financial Services does not predict the direction of consumer credit conditions, delinquency rates, lending practices, credit reporting or furnishing practices, credit scoring model adoption, regulation, legislation, litigation outcomes, inflation, interest rates, economic growth, or securities markets, and nothing in this post should be read as such a prediction. Statements about credit reporting practices, scoring models, product terms, and state and federal law describe the status as of the publication date only and may change. Past data does not indicate future results.
Registration and affiliations. Kimberlite Financial Services LLC is an investment adviser registered with the State of Utah. It may transact business only in states where it is registered or is excluded or exempt from registration. Kimberlite Financial Services is not affiliated with the Board of Governors of the Federal Reserve System, the Federal Reserve Bank of New York, the Federal Reserve Bank of Richmond, or any other Federal Reserve Bank; the Consumer Financial Protection Bureau; the U.S. Department of the Treasury; the U.S. Census Bureau; the Utah state courts; The Pew Charitable Trusts; Fair Isaac Corporation (FICO); Experian, TransUnion, or Equifax; LendingTree; Bankrate; Semrush or Exploding Topics; or any other government agency, research organization, credit bureau, or company named above.
Conflict of Interest Disclosure. Ryan J. Hammett is the sole member of Kimberlite Insurance Services LLC, a separate, affiliated insurance agency, and is a licensed insurance producer who may receive commissions on insurance products sold through that entity. This creates a conflict of interest with respect to any discussion of insurance. The body of this post does not discuss, evaluate, or recommend any insurance product, plan, or carrier. The planning review described in the call to action above may include discussion of insurance; where it does, this conflict applies, and any insurance product would be placed through Kimberlite Insurance Services LLC on a commission basis.
Before making any financial, investment, tax, credit, or legal decision, consult a qualified professional who can evaluate your specific situation. Kimberlite Financial Services makes no representations or warranties regarding the completeness or accuracy of the information presented.