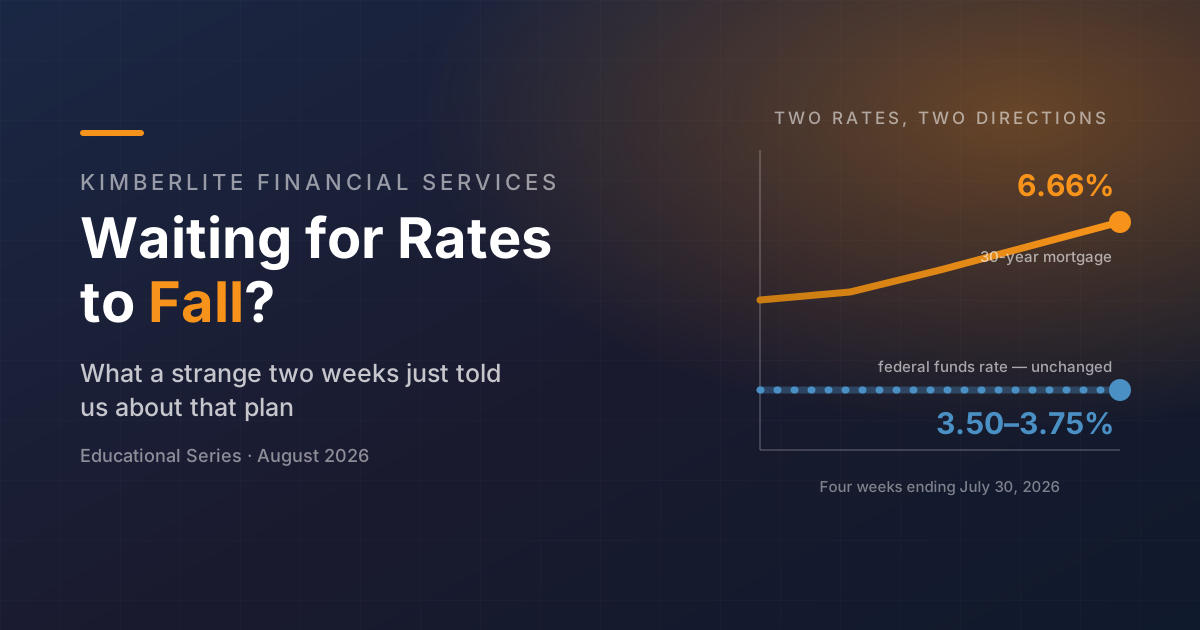
The Federal Reserve held rates steady. Mortgage rates rose anyway — for a fourth straight week. And a new affordability study says Utah would need mortgage rates below 3% to put a median-priced home within reach of a median income. Those three facts belong in the same conversation.
Interest rates ran the financial news through the last two weeks of July — the Fed's decision, four straight weekly increases in mortgage rates, and a Utah affordability study that got a lot of attention locally. Here's what actually happened, why your mortgage rate and the Fed's rate are less connected than most people assume, and what the arithmetic says about the most common housing plan in America right now: waiting.
Most weeks, the financial news does not require a re-read. The last two weeks of July did.
The Federal Reserve met and changed nothing. Mortgage rates went up. The most-watched inflation input — energy — went up, then the war driving it appeared to wind down over a weekend. And in the middle of it, a housing analysis landed with a number that reframes the entire question people are actually asking.
Two of those numbers deserve a second look.
The 9–3 vote was described in press coverage as the most hawkish FOMC vote in nearly a decade. Cleveland's Beth Hammack, Minneapolis' Neel Kashkari, and Dallas' Lorie Logan all dissented, and all three preferred to raise rates by a quarter point at that meeting. Three officials dissenting in the same direction had not happened since September 2016. Chair Kevin Warsh described the debate as a family fight he had asked for.
The September odds are the more useful number, because of how they behaved. In roughly two weeks they went from under 53%, to about 82%, to 72.3% — without a single change in Fed policy. Nothing about the central bank moved. The oil market moved, and the odds followed.
This is the part that confuses almost everyone, and it is worth getting straight, because it explains why "wait for the Fed to cut" is a weaker plan than it sounds.
So what was moving in the background? Energy, and the war behind it.
The U.S. and Israel attacked Iran on February 28. An interim agreement in mid-June halted the fighting and was supposed to lead to a permanent deal; it collapsed within weeks as attacks on shipping in the Strait of Hormuz resumed. Brent crude settled at $89.22 on July 20 and pushed past $100 by July 23 — its first time above that mark since May. The national average price of gasoline crossed $4.00 a gallon on July 20 and reached $4.09 by July 24. CNBC reported on July 23 that climbing oil prices were the direct driver of the surge in rate-hike odds; the reporting available did not attribute the move in the 10-year Treasury to any single cause, so treat the connection as a reasonable inference rather than an established fact.
Energy is a difficult kind of inflation for a central bank to address. A supply shock raises prices without raising demand — the economy gets more expensive and no stronger. Rate increases can restrain demand. They cannot re-open a shipping lane.
It cuts both ways, and recently did. Falling fuel prices helped pull headline inflation down to 3.5% in June from 4.2% in May; the CPI index itself fell 0.4% for the month, the largest one-month decline since April 2020. The same lever that produced that relief is the one that reversed in July.
On July 21, the Deseret News reported an analysis from Ziffy.ai, a real estate investment platform, that asked a deceptively simple question across 364 U.S. metro areas: how far would mortgage rates have to fall for a household earning the local median income to afford the local median-priced home?
The model assumes 20% down, a 30-year loan, a cap of 30% of gross household income spent on housing, 1.1% property tax, and 0.5% homeowners insurance, using Realtor.com and Census data. The Utah results:
That last row is not a typo. Under the model's assumptions, St. George's principal, property tax, and homeowners insurance alone come to roughly $2,229 a month against an affordability ceiling of about $2,175 — meaning a zero percent mortgage still misses by about $54 a month, before a dollar of interest is added. Ziffy.ai's founder made exactly that point: on those inputs, the gap is structural rather than a rate problem.
Nationally, the study reported 42 of 364 metros in the same position, 110 that would need rates below 3%, and only 48 that qualified as affordable at a 6.49% rate.
Fair is fair: waiting sometimes wins. So let's do the arithmetic honestly, in both directions.
Salt Lake County's median single-family home price reached $645,000 in the second quarter of 2026 — up 4.88% year over year and the highest quarterly median on record, according to the Salt Lake Board of Realtors. That was not the whole state's story: over the same quarter, Davis County's median single-family price fell 1.57% to $568,450, on 2.76% fewer sales. Take Salt Lake County as the starting point for the arithmetic: 20% down ($129,000), a $516,000 loan, 30 years, principal and interest only.
Two things fall out of that table.
First, price appreciation eats most of a moderate rate decline. In the second scenario, a rate drop of nearly a full percentage point nets $158 a month — because the same 4.88% appreciation that raised the price also raised the 20% down payment by $6,295. At $158 a month, recovering just that larger down payment takes about 40 months. The monthly number improved; the cash required to get in the door got worse.
Second, the range of outcomes is wide and it is not symmetrical around "better." The same one-year wait produces anything from $328 a month saved to $468 a month more, depending on two variables nobody controls.
None of the above is a prediction, a recommendation, or a statement about what any particular household should do. The rates and price changes shown are chosen to illustrate a range, not to forecast one. The value of the exercise is that it replaces a binary question — will rates go down? — with a better one: which combinations of rate and price would actually change my decision, and how likely is each?
Higher rates are a cost when you borrow and a benefit when you lend. Almost all of the search traffic goes to the first half.
Through late July, the most competitive nationally available certificates of deposit were advertising yields in the range of roughly 4.45% to 4.50% APY, per Fortune's daily surveys, and competitive high-yield savings accounts were in a broadly similar range. The FDIC's national average savings account rate as of July 20 was 0.38%.
That is a simple interest illustration using advertised rates as of late July 2026, not an offer, not a projection, and not a specific product recommendation. Rates on savings accounts are variable and can change without notice; CDs generally lock a rate but impose penalties for early withdrawal; and federal deposit insurance applies only up to applicable limits per depositor, per institution, per ownership category. The broader point stands: in a higher-rate environment, the cost of leaving cash idle is unusually visible.
The honest summary of the last two weeks is that a lot happened and very little was settled. The Fed held while three of its own officials argued for the opposite. Mortgage rates rose without the Fed moving at all. Energy prices spiked on a war, and then the war's outlook shifted over a single weekend.
What did not change is the arithmetic. A payment is a function of price, rate, term, taxes, insurance, and cash on hand. Five of those six are knowable today. Only one requires a forecast — and it is the one everybody is searching for.
That is not an argument for buying, or for waiting. It is an argument for knowing which of those levers you actually control, and building around those instead. A plan constructed from the five knowable inputs survives a surprising headline. A plan built on the sixth is a bet on the news.
Kimberlite Financial Services offers educational planning reviews that put housing costs, cash reserves, debt, taxes, and long-term goals into one connected picture — so that a decision this large doesn't rest on a rate forecast.
Educational Content Only. This content is provided by Kimberlite Financial Services for educational and informational purposes only. It is not personalized investment, tax, legal, insurance, mortgage, lending, or real estate advice, and should not be relied upon as such. Nothing in this post is a recommendation to buy, sell, hold, or refinance any property; to obtain, delay, or decline any loan; to open any deposit account or certificate of deposit; or to purchase any security or insurance product. The information reflects publicly available reporting and government data as of the date of publication and may become outdated quickly — several figures discussed here changed materially within the two weeks the post describes.
Illustrations are hypothetical. All payment, savings, and break-even figures are arithmetic illustrations using round assumptions stated in the text, calculated by Kimberlite Financial Services from publicly reported rates and prices. They are not quotes, offers, predictions, or performance results, and they do not reflect any individual's actual loan terms, taxes, insurance, mortgage insurance, HOA dues, closing costs, credit profile, or eligibility. Actual results will differ. Advertised deposit and mortgage rates are national figures reported by third parties; individual rates vary by lender, institution, product, term, credit, and location, and are subject to change without notice. Deposit insurance limits apply per depositor, per insured institution, per ownership category.
No predictions. Interest rate probabilities described here are market-implied prices reported by third parties, not forecasts by Kimberlite Financial Services. Kimberlite Financial Services does not predict the direction of interest rates, home prices, energy prices, inflation, or geopolitical events, and nothing in this post should be read as such a prediction.
Registration and affiliations. Kimberlite Financial Services LLC is an investment adviser registered with the State of Utah. Kimberlite Financial Services is not a mortgage lender, mortgage broker, bank, credit union, or real estate brokerage; is not affiliated with Freddie Mac, the Federal Reserve, or any government agency; and receives no compensation from any lender, bank, depository institution, real estate brokerage, or the third-party sources cited above in connection with this content.
Conflict of Interest Disclosure. Ryan J. Hammett is the sole member of Kimberlite Insurance Services LLC, a separate, affiliated insurance agency, and is a licensed insurance producer who may receive commissions on insurance products sold through that entity. This creates a conflict of interest with respect to any discussion of insurance. This post references homeowners insurance only as a component of a third party's affordability model and does not recommend any insurance product, carrier, or policy.
Before making any financial, housing, borrowing, tax, or insurance decision, consult a qualified professional who can evaluate your specific situation. Kimberlite Financial Services makes no representations or warranties regarding the completeness or accuracy of the information presented.