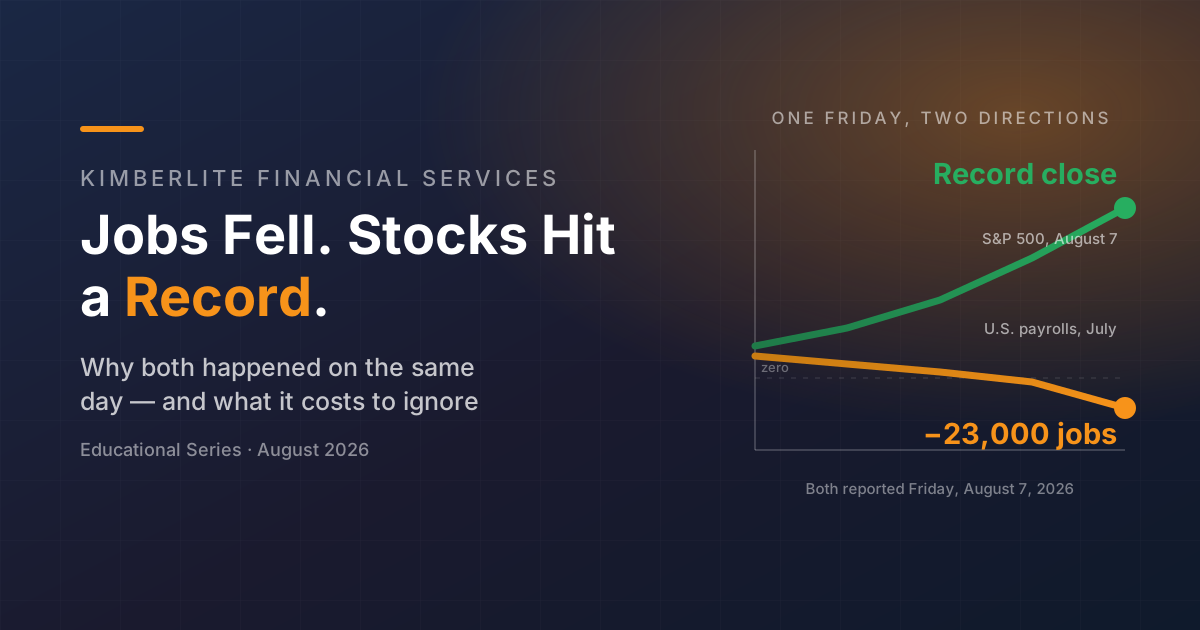
On August 7 the government reported that the U.S. economy lost 23,000 jobs in July. Within hours the S&P 500 closed at an all-time high. Neither headline is wrong, and neither one is about your household. The numbers underneath them are.
Last Friday produced two headlines that appear to contradict each other. They don't. Understanding why they fit together is one of the more useful things a household can learn about how markets work — and the details buried below both headlines matter considerably more to your budget than either one.
The U.S. Bureau of Labor Statistics released the July employment report at 8:30 a.m. Eastern on Friday, August 7. Nonfarm payroll employment fell by 23,000. Forecasters had expected a gain in the neighborhood of 83,000.
By the closing bell, the S&P 500 had risen about 0.6% to a record close, finishing its strongest week since April.
If that reads like a contradiction, it isn't one. It is the market doing something specific, for a specific reason, and the reason is worth understanding — because it also explains why the stock market's opinion of the economy is not the same thing as your household's experience of it.
The first three numbers made the news. The fourth is the one that changes the picture, and we'll come back to it.
Start with the simple version, then we'll add the complications.
That is the mechanism. Now the part that matters more.
Nobody was celebrating job losses. What changed was the price of one variable — the expected path of interest rates — and that variable moves stock prices a great deal in the short run. The move was about the Fed, not about prosperity.
This distinction gets lost constantly, in both directions. A rising market is read as proof the economy is fine. A falling market is read as proof it isn't. Neither inference holds, because the stock market and the household economy are measuring different things over different horizons. The S&P 500 is a claim on the future profits of roughly 500 large, mostly global companies. Your household is a claim on your paycheck.
Those two things are related. They are not the same thing, and last Friday was an unusually clean demonstration of the gap.
Underneath the top-line number, the July report contained four details that received far less attention and carry more information.
The revisions. May and June payroll growth was revised down by a combined 103,000 jobs. May went from +129,000 to +63,000. June went from +57,000 to +20,000. This is routine — BLS revises as more employer reports arrive — but the direction and size matter. Two months that looked like modest growth now look like very little growth. The three-month picture is materially weaker than it appeared six weeks ago.
Temporary layoffs jumped. The number of unemployed people on temporary layoff rose by 153,000 in July, to 921,000 — a large one-month move. Permanent job losers, by contrast, were little changed at about 1.7 million. Whether temporary layoffs convert into permanent ones is not something this report answers.
Fewer people are in the labor force. The labor force participation rate was 61.4% in July, down 0.7 percentage point since January. The employment-population ratio was 58.9%, down 0.5 point over the same span. This is part of why the headline unemployment rate can look stable while hiring stalls. By BLS's own definition, the rate is the number of unemployed as a percentage of the labor force, and being counted as unemployed requires actively looking for work — so someone who stops looking leaves the calculation entirely rather than pushing the rate up.
Some industries are having a much worse year than the average. Employment in financial activities fell 14,000 in July and is down 121,000 since a recent peak in May 2025. Local government education fell 50,000 in the month, and retail trade fell 19,000. Health care kept growing (+22,000), but more slowly than its 12-month average of +36,000.
Now put the labor data next to the price data. This is where the household effect should show up — and it's also the single easiest place in economics to mislead someone, including yourself.
Average hourly earnings for all private employees were $37.62 in July, up 3.2% over the year. To find out whether that's a raise in real terms, you subtract inflation. The problem is that there are four commonly used inflation measures, and they don't agree.
Four measures, all published by the federal government, all covering the same period, producing answers that range from a pay cut to a raise. Nothing has been cherry-picked here except by whoever shows you only one row.
Two technical notes on that table, because they matter. The wage figure is from July and the price figures are from June — the periods don't perfectly align, since June is the latest available for all four indexes. And average hourly earnings are a rough proxy for take-home pay; they shift when the mix of jobs in the economy changes, not only when individual workers get raises.
That is a considerably less dramatic conclusion than "wages aren't keeping up," which is the version most likely to reach you in a headline. It is also the accurate one. Anyone — including a financial firm — who tells you wages are collapsing or surging is choosing a deflator to get there.
What is unambiguous is the buffer. The personal saving rate was 2.7% in June. That is an aggregate figure — total personal saving divided by total disposable personal income across the whole economy, not the median household's saving rate, and it is heavily influenced by high earners. But even read carefully, it describes an economy in which saving out of current income is thin.
Growth has also slowed. Real GDP grew at a 1.5% annual rate in the second quarter, down from 2.1% in the first, according to the Commerce Department's advance estimate. Slower but positive.
State data runs a month behind the national report, so the most recent Utah figures cover June, released by the Department of Workforce Services in July.
Utah entered this stretch with a lower unemployment rate than the nation and with employment still growing. That is a real advantage and worth stating plainly.
Two caveats belong with it. First, June state data predates the July national deterioration, so it does not tell us how Utah fared last month. Second, a strong state average is not protection for any particular household — the industry composition point applies inside Utah exactly as it does nationally.
This is the section worth keeping. Most people have never looked up these numbers, and they are all published, specific, and knowable in advance — which makes them the opposite of a forecast.
Utah's unemployment insurance benefit schedule for calendar year 2026, published by the Department of Workforce Services, sets out the following:
Those are ceilings, not typical amounts. Your weekly benefit is calculated from your highest-earning calendar quarter in the base period, and your number of payable weeks is calculated separately from total base-period wages. Most claimants receive less than the maximum on both counts. Eligibility also depends on the circumstances of the separation, not only on earnings, and only the Department of Workforce Services can determine it.
Note that $806 × 26 weeks is exactly $20,956 — the weekly cap and the annual cap are the same constraint. Expressed monthly, the maximum works out to about $3,493 (a Kimberlite calculation: $806 × 52 ÷ 12; DWS does not publish a monthly figure).
Set that ceiling against a household budget. The Census Bureau's QuickFacts puts Utah's median household income at $95,166 in 2024 dollars, using five-year American Community Survey data for 2020–2024 — about $7,931 a month before taxes. At the maximum, unemployment insurance would replace roughly 44% of that monthly figure for a single-earner household while benefits last — and since they last at most 26 weeks, the $20,956 annual ceiling is about 22% of a full year at that income. The benefit is also taxable income at both the federal and Utah level. (Census's separate annual survey puts Utah's 2024 median household income higher, near $104,000, which would put the replacement rate closer to 40%. The two surveys are built differently; neither is wrong.)
Those figures are simple arithmetic on stated assumptions — a $6,000 monthly spend chosen for round numbers, the maximum benefit rather than a typical one, no taxes withheld, no severance, no second income, and no reduction in spending. Three of those would improve the result if they applied to you — severance, a second income, cutting spending. Two would make it worse, and they are the two that apply to almost everyone: most claimants receive less than the maximum, and the benefit is taxable. Change the inputs and the answer changes; that is the point of running it.
The duration figures come from the same July BLS report. Nationally, the median spell of unemployment was 10.5 weeks — actually down from 11.0 weeks in June. But the average was 24.9 weeks, and 25.5% of unemployed people had been jobless 27 weeks or longer.
For context on how thin the typical buffer is: Bankrate's 2026 emergency savings survey, released January 21, 2026 on fieldwork conducted December 2–8, 2025, reported that 30% of Americans said they would pay a $1,000 emergency expense from savings, that 33% said they would go into debt to cover it (credit card 17%, family or friends 12%, personal loan 3%), and that nearly one in four — 24% — had no emergency savings at all. Two limitations worth holding onto: those are stated intentions rather than measured account balances, and the fieldwork predates every labor market figure discussed above.
Two true things happened on the same Friday. The economy shed jobs, and stocks closed at a record. The market was repricing interest rate expectations; the labor report was describing employment. Both were accurate, and neither was about your household.
What is about your household sits underneath both: hiring has slowed more than the top-line numbers suggested a month ago, real wages are close to flat and can be shown as either a small gain or a small loss depending on the price index used, growth decelerated to 1.5% in the second quarter, aggregate saving is 2.7% of disposable income, and the public safety net in Utah tops out at $806 a week for at most 26 weeks.
Every one of those figures is published today. None of them requires a forecast. A household that knows its own monthly spending, its own likely benefit amount, and its own coverage options has already done the work that actually matters this month — and it will still have done that work regardless of what the next jobs report says.
That is not a prediction that conditions will worsen. Median unemployment spells got shorter in July, the unemployment rate edged down, Utah is outperforming the nation on both rate and job growth, and BLS's own real earnings measure showed hourly wages up 0.1% for all employees, down 0.1% for production and nonsupervisory workers, and weekly earnings up 0.3% for both. The case for knowing your own numbers doesn't depend on which way the next report breaks. That's the entire appeal of it.
Kimberlite Financial Services offers educational planning reviews that connect cash reserves, income stability, debt, insurance, taxes, and long-term goals into one picture — so that a change in your employment situation isn't the first time you run the math. Advisory services are provided for compensation; our services, fees, and conflicts of interest are described in Form ADV Part 2A and Form CRS, available on request and at adviserinfo.sec.gov.
Educational Content Only. This content is provided by Kimberlite Financial Services for educational and informational purposes only. It is not personalized investment, tax, legal, insurance, employment, benefits, or career advice, and should not be relied upon as such. Nothing in this post is a recommendation to buy, sell, or hold any security; to make or avoid any change to an investment portfolio; to open, close, or fund any account; to purchase any insurance product; or to take or refrain from any employment action. The information reflects publicly available reporting and government data as of the date of publication and may become outdated quickly — the employment figures discussed here are explicitly subject to revision. BLS will publish a preliminary estimate of its annual benchmark revision on August 28, 2026; official establishment survey estimates are not updated based on that preliminary estimate, and the final benchmark revision is scheduled to be published with the January 2027 report in February 2027.
Illustrations are hypothetical. All budget, benefit, savings-gap, and real-wage figures are arithmetic illustrations using round assumptions stated in the text, calculated by Kimberlite Financial Services from publicly reported government data. They are not quotes, offers, projections, benefit determinations, or performance results, and they do not reflect any individual's actual income, spending, tax situation, severance, household composition, or benefit eligibility. Actual results will differ.
No predictions. Interest rate probabilities described here are market-implied prices reported by third parties, not forecasts by Kimberlite Financial Services. Kimberlite Financial Services does not predict the direction of employment, interest rates, inflation, economic growth, or securities markets, and nothing in this post should be read as such a prediction. Past market movements do not indicate future results.
Unemployment benefits. Unemployment insurance amounts, durations, and eligibility rules cited here are drawn from the Utah Department of Workforce Services published 2026 benefit schedule and are subject to change. Kimberlite Financial Services is not an unemployment insurance administrator, employment agency, career counselor, benefits administrator, health insurance Marketplace navigator, or law firm, and does not determine eligibility for any government benefit. Only the Utah Department of Workforce Services can determine unemployment insurance eligibility and benefit amounts. Unemployment compensation is generally taxable income for federal and Utah state income tax purposes; consult a qualified tax professional regarding your situation.
Registration and affiliations. Kimberlite Financial Services LLC is an investment adviser registered with the State of Utah. Kimberlite Financial Services is not a bank, credit union, or broker-dealer; is not affiliated with the U.S. Bureau of Labor Statistics, the Bureau of Economic Analysis, the U.S. Census Bureau, the Federal Reserve, the Utah Department of Workforce Services, HealthCare.gov, or any other government agency; and receives no compensation from any depository institution, insurer, employer, or the third-party sources cited above in connection with this content.
Conflict of Interest Disclosure. Ryan J. Hammett is the sole member of Kimberlite Insurance Services LLC, a separate, affiliated insurance agency, and is a licensed insurance producer who may receive commissions on insurance products sold through that entity. This creates a conflict of interest with respect to any discussion of insurance. This post refers to health coverage continuation and Marketplace enrollment only as procedural considerations following a job loss, and does not recommend any insurance product, plan, or carrier.
Before making any financial, investment, tax, insurance, benefits, or employment decision, consult a qualified professional who can evaluate your specific situation. Kimberlite Financial Services makes no representations or warranties regarding the completeness or accuracy of the information presented.